2.5 + 3.1...................is 5.6................................the blue seems to be going to 2.............(2, 0)........on the x axis.......................in the positive direction........2 to the i.................has a distance of 3 along the X axis.................................to one up in the imag direction.............one above - 1...........i is the square root of - 1...............If u add the two together.........the distance from the 1st zero on the X axis ..........they say there are zeros at every neg even interger...............- 2.....is the 1st..............so if 2^i.............i as an exponent.............is taken from (2, 0).............it would be a distance of 3 along the X axis...................................and from the 1st zero on the X axis to where the critical line crosses the X axis.........at 1/2............(1/2, 0).......................is a distance of 2.5.............b/c of inverted and fractal dimensions.........I made 3.1..........................to include the distance in the 3d or imag direction..........up from the paper to the imag direction.........that they equal 5.6.......is sig to me.........6.5.......................is sym......with that........reflex sym....................1/2 (13) = 6.5.........6.5.......is the average or dead center of 2 - 11.........what I call the prime fund.........and there may be more than one ...................................also.........28 + 28 = 56..............28 is in e twice............in the 1st ten digits............connection...................................and fractal dimensions...........etc........
The plots above show the real and imaginary parts of

plotted in the complex plane together with the
complex modulus of

. As can be seen, in right half-plane, the function is fairly flat, but with a large number of horizontal ridges. It is precisely along these ridges that the nontrivial zeros of

lie.

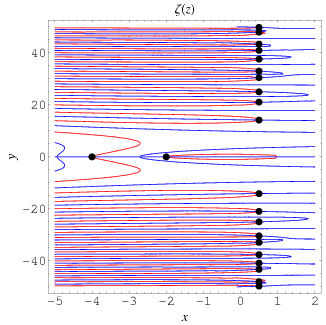
The position of the complex zeros can be seen slightly more easily by plotting the contours of zero real (red) and imaginary (blue) parts, as illustrated above. The zeros (indicated as black dots) occur where the curves intersect.
 The position of the complex zeros can be seen slightly more easily by plotting the contours of zero real (red) and imaginary (blue) parts, as illustrated above. The zeros (indicated as black dots) occur where the curves intersect.
No comments:
Post a Comment