e is the base rate of growth shared by all continually growing processes. e lets you take a simple growth rate (where all change happens at the end of the year) and find the impact of compound, continuous growth, where every nanosecond (or faster) you are growing just a little bit.
e shows up whenever systems grow exponentially and continuously: population, radioactive decay, interest calculations, and more. Even jagged systems that don’t grow smoothly can be approximated by e.
Just like every number can be considered a scaled version of 1 (the base unit), every circle can be considered a scaled version of the unit circle (radius 1), and every rate of growth can be considered a scaled version of e (unit growth, perfectly compounded).
So e is not an obscure, seemingly random number. e represents the idea that all continually growing systems are scaled versions of a common rate.
Understanding Exponential Growth
Let's start by looking at a basic system that doubles after an amount of time. For example,- Bacteria can split and “doubles” every 24 hours
- We get twice as many noodles when we fold them in half.
- Your money doubles every year if you get 100% return (lucky!)
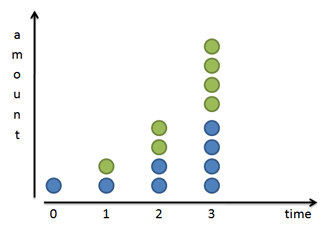
Splitting in two or doubling is a very common progression. Sure, we can triple or quadruple, but doubling is convenient, so hang with me here.
Mathematically, if we have x splits then we get 2x times as much stuff than when we started. With 1 split we have 21 or 2 times as much. With 4 splits we have 24 = 16 times as much. As a general formula:

Said another way, doubling is 100% growth. We can rewrite our formula like this:
It’s the same equation, but we separate 2 into what it really is: the original value (1) plus 100%. Clever, eh?
Of course, we can substitute any number (50%, 25%, 200%) for 100% and get the growth formula for that new rate. So the general formula for x periods of return is:
This just means we use our rate of return, (1 + return), “x” times.
A Closer Look
Our formula assumes growth happens in discrete steps. Our bacteria are waiting, waiting, and then boom, they double at the very last minute. Our interest earnings magically appear at the 1 year mark. Based on the formula above, growth is punctuated and happens instantly. The green dots suddenly appear.The world isn’t always like this. If we zoom in, we see that our bacterial friends split over time:
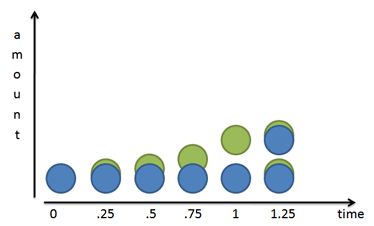
Mr. Green doesn’t just show up: he slowly grows out of Mr. Blue. After 1 unit of time (24 hours in our case), Mr. Green is complete. He then becomes a mature blue cell and can create new green cells of his own.
Does this information change our equation?
Nope. In the bacteria case, the half-formed green cells still can’t do anything until they are fully grown and separated from their blue parents. The equation still holds.
Money Changes Everything
But money is different. As soon as we earn a penny of interest, that penny can start earning micro-pennies of its own. We don’t need to wait until we earn a complete dollar in interest — fresh money doesn’t need to mature.Based on our old formula, interest growth looks like this:
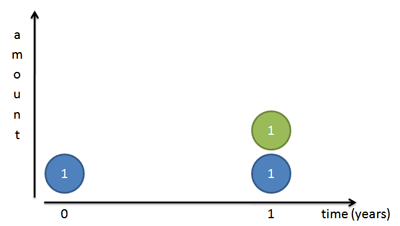
But again, this isn’t quite right: all the interest appears on the last day. Let’s zoom in and split the year into two chunks. We earn 100% interest every year, or 50% every 6 months. So, we earn 50 cents the first 6 months and another 50 cents in the last half of the year:
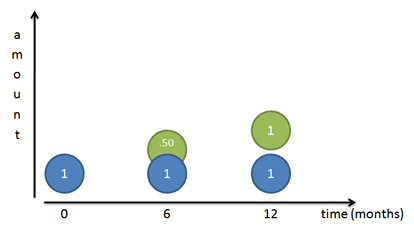
But this still isn’t right! Sure, our original dollar (Mr. Blue) earns a dollar over the course of a year. But after 6 months we had a 50-cent piece, ready to go, that we neglected! That 50 cents could have earned money on its own:
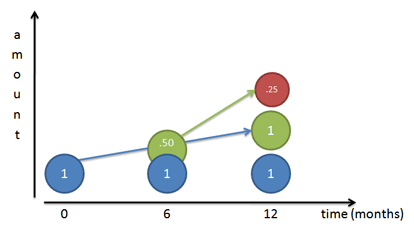
Because our rate is 50% per half year, that 50 cents would have earned 25 cents (50% times 50 cents). At the end of 1 year we’d have
- Our original dollar (Mr. Blue)
- The dollar Mr. Blue made (Mr. Green)
- The 25 cents Mr. Green made (Mr. Red)
Let’s turn our return into a formula. The growth of two half-periods of 50% is:
Diving into Compound Growth
It’s time to step it up a notch. Instead of splitting growth into two periods of 50% increase, let’s split it into 3 segments of 33% growth. Who says we have to wait for 6 months before we start getting interest? Let’s get more granular in our counting.Charting our growth for 3 compounded periods gives a funny picture:
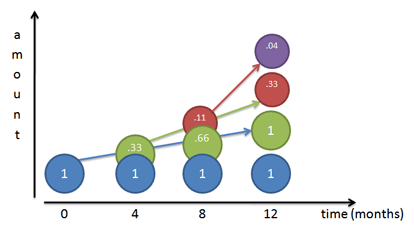
Think of each color as shoveling money upwards towards the other colors (its children), at 33% per period:
- Month 0: We start with Mr. Blue at $1.
- Month 4: Mr. Blue has earned 1/3 dollar on himself, and creates Mr. Green, shoveling along 33 cents.
- Month 8: Mr. Blue earns another 33 cents and gives it to Mr. Green, bringing Mr. Green up to 66 cents. Mr. Green has actually earned 33% on his previous value, creating 11 cents (33% * 33 cents). This 11 cents becomes Mr. Red.
- Month 12: Things get a bit crazy. Mr. Blue earns another 33 cents and shovels it to Mr. Green, bringing Mr. Green to a full dollar. Mr. Green earns 33% return on his Month 8 value (66 cents), earning 22 cents. This 22 cents gets added to Mr. Red, who now totals 33 cents. And Mr. Red, who started at 11 cents, has earned 4 cents (33% * .11) on his own, creating Mr. Purple.
Take some time to really understand what’s happening with this growth:
- Each color earns interest on itself and hands it off to another color. The newly-created money can earn money of its own, and on the cycle goes.
- I like to think of the original amount (Mr. Blue) as never changing. Mr. Blue shovels money to create Mr. Green, a steady 33 every 4 months since Mr. Blue does not change. In the diagram, Mr. Blue has a blue arrow showing how he feeds Mr. Green.
- Mr. Green just happens to create and feed Mr. Red (green arrow), but Mr. Blue isn’t aware of this.
- As Mr. Green grows over time (being constantly fed by Mr. Blue), he contributes more and more to Mr. Red. Between months 4-8 Mr. Green gives 11 cents to Mr. Red. Between months 8-12 Mr. Green gives 22 cents to Mr. Red, since Mr. Green was at 66 cents during Month 8. If we expanded the chart, Mr. Green would give 33 cents to Mr. Red, since Mr. Green reached a full dollar by Month 12.
We get a formula by using 3 periods in our growth equation:
We earned $1.37, even better than the $1.25 we got last time!
No comments:
Post a Comment