From the iterates of the Julia sets...............1.5.........seems some kind of threshold..............from the critical line at 1/2 to 2.........the imaginary parts...........seem to be extending 3/2 or 1.5..........to 2....

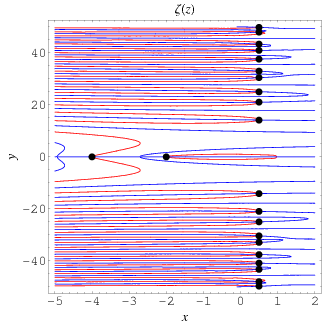
The position of the complex zeros can be seen slightly more easily by plotting the contours of zero real (red) and imaginary (blue) parts, as illustrated above. The zeros (indicated as black dots) occur where the curves intersect.

The figures above highlight the zeros in the complex plane by plotting (where the zeros are dips) and
  (where the zeros are peaks).

The above plot shows for
for  between 0 and 60. As can be seen, the first few nontrivial zeros occur at the values given in the following table (Wagon 1991, pp. 361-362 and 367-368; Havil 2003, p. 196; Odlyzko), where the corresponding negative values are also roots. The integers closest to these values are 14, 21, 25, 30, 33, 38, 41, 43, 48, 50, ... (OEIS A002410). The numbers of nontrivial zeros less than 10,
  ,
,  , ... are 0, 29, 649, 10142, 138069, 1747146, ... (OEIS A072080; Odlyzko).

The position of the complex zeros can be seen slightly more easily by plotting the contours of zero real (red) and imaginary (blue) parts, as illustrated above. The zeros (indicated as black dots) occur where the curves intersect.

The figures above highlight the zeros in the complex plane by plotting

The above plot shows
| Sloane | ||
| 1 | A058303 | 14.134725 |
| 2 | 21.022040 | |
| 3 | 25.010858 | |
| 4 | 30.424876 | |
| 5 | 32.935062 | |
| 6 | 37.586178 |
Comments
Post a Comment